One of the significant applications in geophysical exploration is Electrical Resistivity Tomography (ERT), a technique widely used to investigate shallow, near-surface structures. Its scope of application is extensive, encompassing areas such as the detection of archaeological features, solid and liquid waste sites, buried near-surface military materials, engineering and construction structures, and the characterization of hydrogeological environments. It is also employed to identify various geological phenomena—including faults, landslides, and karstic voids—to assess the geophysical properties of ground intended for large-scale construction projects based on electrical principles, and to conduct investigations in geothermal areas. Electrical Resistivity Tomography (ERT) is a frequently utilized method for addressing these types of challenges, consistently yielding effective results.
In recent years, the emergence of multi-channel instruments and equipment capable of collecting resistivity data suitable for 2D and 3D assessment has led to an increase in the study of shallow structures. Today, the Electrical Resistivity Tomography (ERT) technique is widely used in investigations aimed at identifying shallow geological structures, addressing engineering, environmental, and hydrogeological issues, and locating archaeological remains. In this method, an electrical current is injected into the subsurface via two points on the ground surface, while the resulting potential—generated by this current—is measured at two other points. Based on Ohm’s law, the apparent resistivity is calculated, allowing for the characterization of the subsurface in two or three dimensions. The primary requirement for such characterization is to investigate the subsurface—starting from the ground surface down to a desired depth—and to collect data accordingly. This data is then subjected to an inversion process to construct 2D or 3D models of the subsurface.
Geoelectrical methods have long been a popular approach within the field of geophysics. Due to its broad range of applications, the resistivity method is considered a fundamental research tool by many investigators. However, when identifying anomalies using the resistivity method, the characteristics of the buried structure—as well as the specific electrode configuration employed—are of critical importance. Consequently, the apparent resistivity values calculated or measured for a given subsurface model will vary depending on the electrode configuration used. Therefore, selecting an electrode configuration appropriate for the specific objectives of the study is essential for the success of the investigation (Figure 1).
In the investigation of shallow structures, a profiling measurement technique—commonly referred to as horizontal resistivity scanning—is employed. In this technique, measurements taken at various depth levels—depending on the chosen electrode array configuration—are used to construct a “pseudo-section” of the subsurface’s apparent resistivity. Performing such measurements with a single-channel resistivity instrument is highly time-consuming. However, the study of shallow structures requires equipment capable of rapid, precise, and efficient data acquisition. Consequently, multi-electrode systems—designed to meet these specific requirements—have come into widespread use in recent years (Dahlin, 2001).
Computer-controlled data acquisition systems for geoelectrical methods have seen significant advancement over the last 15 years. Such systems typically consist of a resistivity instrument, a computer, a switching unit to manage the electrodes, electrode cables, the necessary connectors, and the electrodes themselves (Van Overmeeren and Ritsema, 1988; Griffiths et al., 1990; Griffiths and Barker, 1993; Dahlin, 2001). With the aid of such equipment and its associated software, users can configure parameters including the type of electrode array, the placement of current and potential electrodes, and the spacing between measurement points. These systems feature 25 or more electrode channels. Furthermore, the spacing between electrodes can be adjusted according to the researcher’s specific needs; while intervals ranging from 1 to 25 meters are generally sufficient for most studies, the configuration also allows for wider electrode spacing if required. During the operations, the cables connected to the electrodes are laid out across the survey area; the electrodes are then driven into the ground and connected to the cables, preparing the system for measurement. Measurements for the desired array configurations are carried out in a short amount of time, after which the survey line is shifted to the next position. The main components that make up such a system, along with the measurement setup itself, are shown in Figure 2.
The emergence of high-sensitivity, rapid data-acquisition electrical resistivity instruments in recent years has made the use of numerical methods for data evaluation essential, thereby enabling more sophisticated interpretations. Numerical techniques, such as finite-difference and finite-element methods, play a significant role in this development. These advancements in computational techniques have facilitated effective 2D and 3D forward and inverse modelling for a wide variety of electrode configurations.
As is well known, forward and inverse modelling are the fundamental algorithms used in the evaluation of geophysical data. Forward modelling—defined as the calculation of the expected response from a subsurface model with known parameters—serves as the primary approach for evaluating geophysical data; it also constitutes a core step within inverse modelling algorithms. Through these approaches, 2D and 3D tomographic images of the subsurface can be generated using measurements taken at the surface across various depth levels. A key advantage of this evaluation method is that it allows for the inclusion of subsurface heterogeneity without the need for oversimplification, making it possible to model complex subsurface structures. In recent years, electrical resistivity tomography—particularly in its 2D form—has gained widespread application globally. Its use in addressing various geological, engineering, and environmental challenges is becoming increasingly significant.
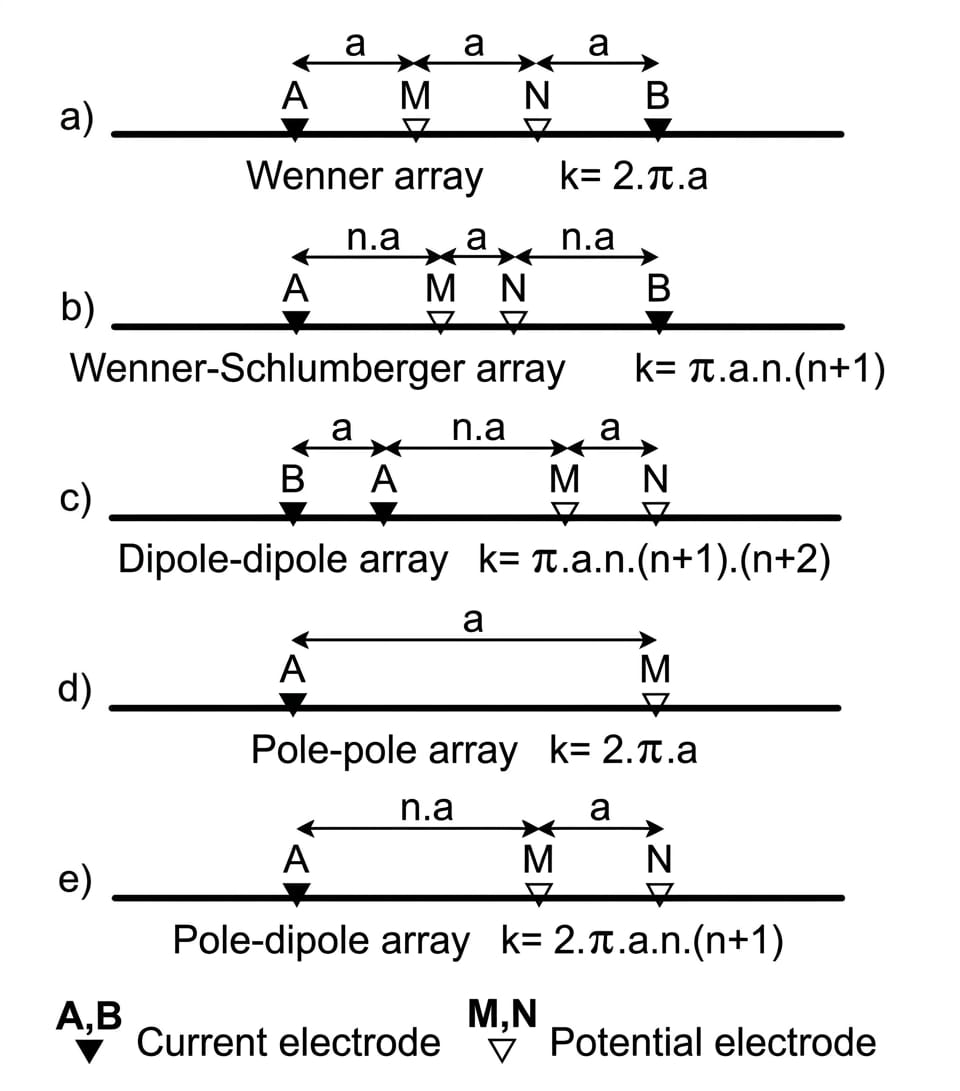
Figure 1: Electrode arrays commonly used in shallow exploration.
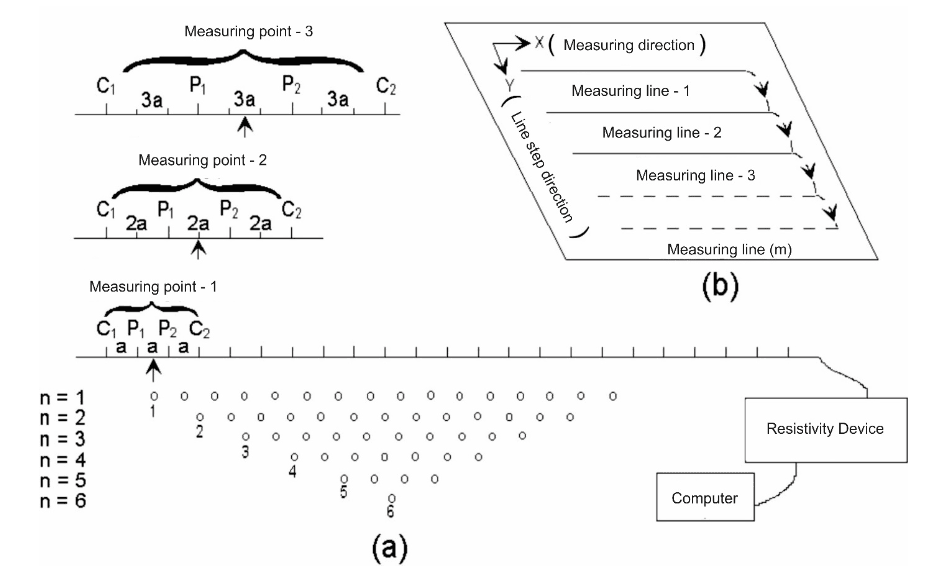
Figure 2: a) Two-dimensional (Griffiths and Barker, 1993) and b) three-dimensional electrical resistivity tomography data acquisition.
The electrical resistivity method is widely used in archaeological research. Although it generally lacks high resolution for features located deeper subsurface, it can be highly effective for identifying buried structures, provided there is sufficient electrical contrast between the soil conditions and the archaeological targets. The method is particularly useful for generating tomographic data, which significantly aids in the interpretation of results. First applied by Wenner in the early 20th century, the technique has been employed in archaeological prospecting since the latter half of the 1940s. Despite the often complex nature of archaeological contexts, the electrical contrast between buried structures and the surrounding soil allows for their detection via the resistivity method (Aitken, 1974). In archaeological settings, the outcome is influenced by a variety of factors, including the general properties of the soil—such as its water and moisture content—the electrical characteristics of the materials composing the target structure, the dimensions and depth of the feature, the specific electrode configuration employed, and whether the structure rests upon the bedrock (Clark, 1996). The method operates on the principle of injecting an electrical current into the ground via two electrodes, measuring the resulting subsurface potential using two additional electrodes, and performing the necessary calculations. When identifying anomalies, both the characteristics of the buried structure and the electrode configuration used are of critical importance; consequently, the apparent resistivity values—whether calculated or measured for a given site model—will vary depending on the specific electrode configuration applied. For this reason, selecting an electrode array appropriate for the purpose of the research is crucial to its success. By varying the distribution of these electrodes on the surface and adjusting the distances between them, different array configurations can be obtained. In their study, Szalai and Szarka (2008) classified more than a hundred electrode arrays described in the literature by examining their properties in terms of superposition, focusing, and linearity.